
Study: Oil Slicks Cover an Ocean Area Twice the Size of Turkey
More than 90% of oil slicks are caused by shipping and human activity on land. Fixing the problem should start with shipping.
[By Niu Yuhan]
Images of seabirds covered in crude oil might bring home the impact of spills on ocean ecosystems, but oil in the oceans doesn’t always come from newsworthy incidents. Regular discharges from land and from ships at sea make up a far bigger proportion – and deserve more attention.
Chinese and US researchers published a paper in Science earlier this year that for the first time sketches out a global map of oil pollution at sea. It found that anthropogenic contributions accounted for around 94% of the cumulative area of ocean oil slicks between 2014 and 2019. The researchers identified 21 oil slick “belts” that match up closely with busy shipping lanes.
The oil in these cases tends to be lighter and more spread out than that from oil spills – and therefore harder to clean up. Like ocean plastic, the dangers of these slicks are not yet fully understood but they may worsen as human activity continues to increase. There is a particular need to toughen oversight of oil discharges from the shipping industry.
What are oil slicks?
An ocean slick is a very thin layer of oil floating at sea. It can be made of crude oil, oil products like fuel oil and diesel, and even vegetable oil.
Unlike big oil spills, slicks tend to drift with the wind, tides and currents. At certain wind speeds they can be spotted on radar. This allowed the research team to process over 560,000 radar images taken between 2014 and 2019 from the Google Earth Engine, and combine these with other data to create a global oil slick dataset and map. They found oil slicks covering a cumulative ocean area of 1,510,000 square kilometers – twice the size of Turkey.
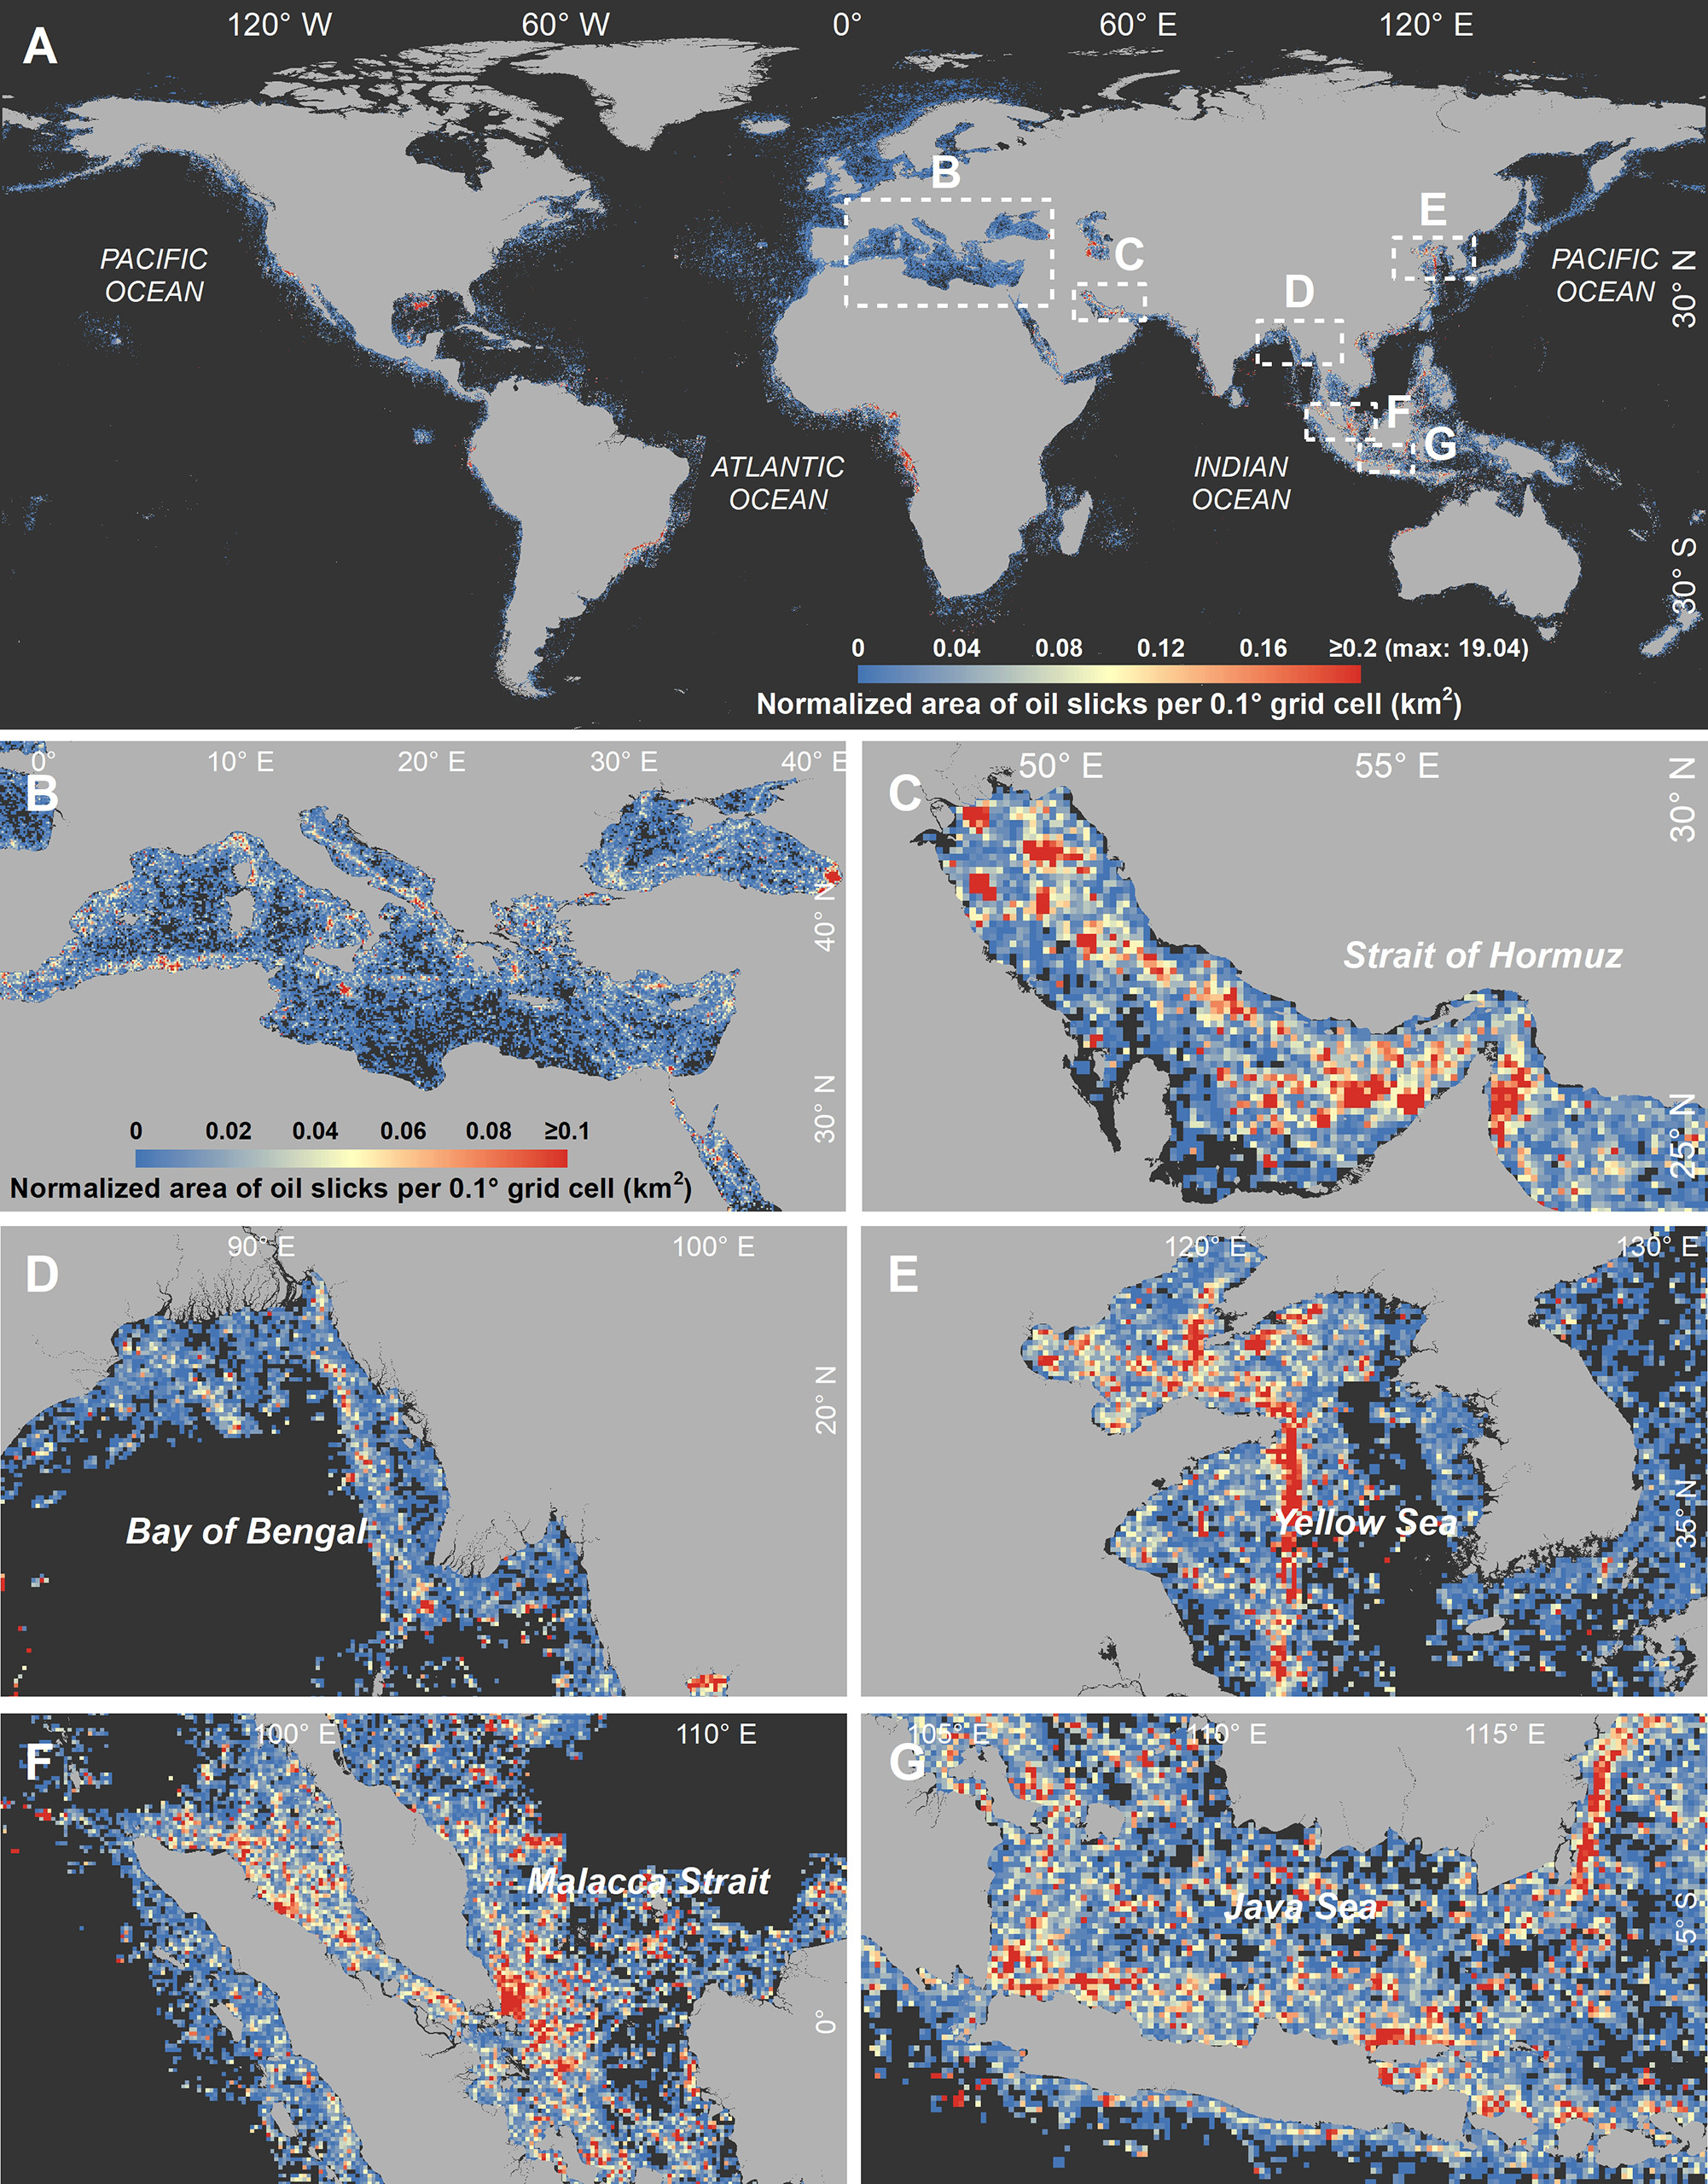
The global distribution of oil slicks. The top map (A) shows how oil slicks are primarily distributed along the coasts. The enlarged views (B–G) of areas marked by white dashed boxes on the top map show high-density belts of oil pollution that coincide with shipping routes. (Graphic © Dong et al, Science 376, 1300–1304 (2022). Reprinted with permission from AAAS.)
While the area covered by oil slicks is relatively small given the size of the ocean, the resulting harm to the environment is significant. The damage depends on how quickly the oil is released, the nature of the oil – in particular, the quantity of toxic compounds it contains – and the vulnerability of the local ecology.
Crude oil forms thick slicks that prevent photosynthesis by phytoplankton, the tiny organisms at the bottom of the ocean food chain. This in turn reduces oxygen levels and causes die-offs.
But more common is long-term exposure to low levels of oil. That can affect survival and breeding rates for seabirds and ocean mammals.
Fish and other forms of ocean life are particularly vulnerable to oil exposure early in their development. Hu Chuanmin, one of the paper’s authors and a professor at the University of South Florida’s College of Marine Science, said: “The eggs of some fish species float on the surface of the ocean and even a tiny amount of oil can be fatal.”
Also, polycyclic aromatic hydrocarbons, which are harmful pollutants that result from burning oil and other fuels, can affect cardiac development in larval fish, as well as accumulating in the food chain and presenting a safety risk to people.
Where does the oil come from?
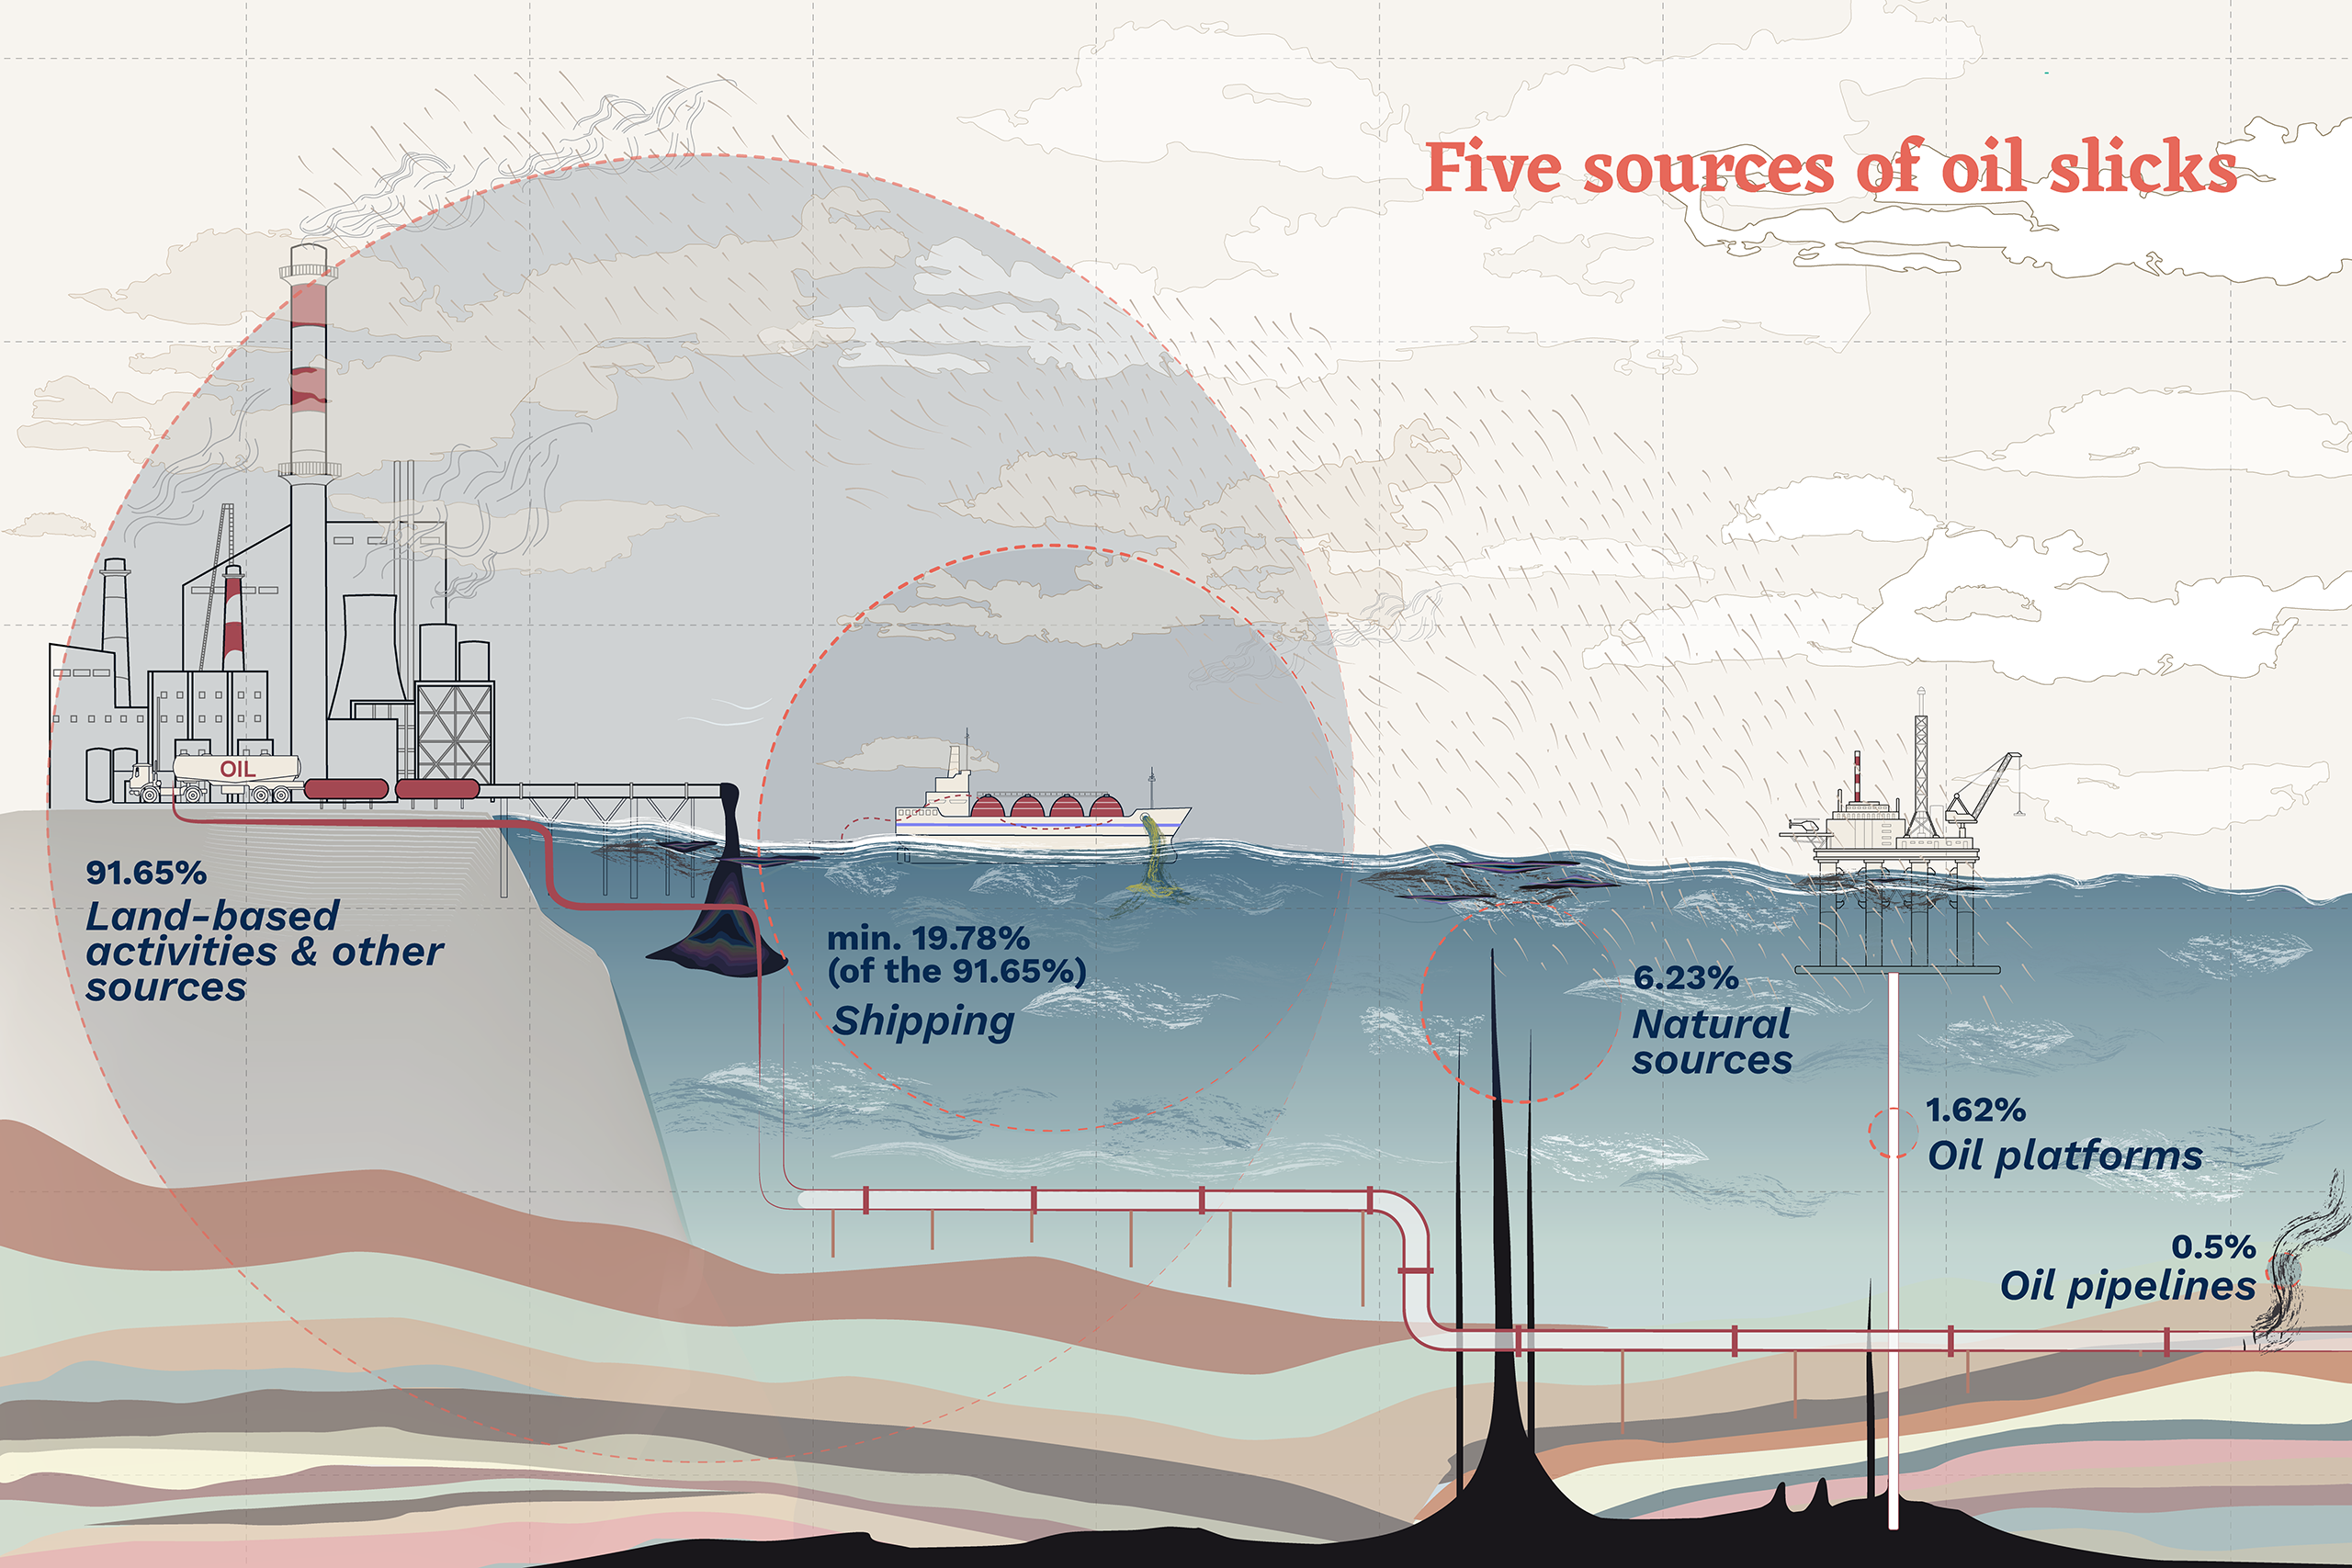
Ocean oil slicks can result from natural or anthropogenic sources. Some oil naturally seeps from fissures in the ocean floor, much like water from a spring; the rate of release is slow and local ecosystems can adapt, or even thrive. Anthropogenic sources include oil platforms and pipelines, but releases are mainly from activities on land and from shipping.
 (Data source: Dong et al, Science 376, 1300–1304 (2022); Graphic: Javiera Pizarro Osorio / China Dialogue Ocean)
In 2003, the US National Research Council (NRC) reported that between 1990 and 1999 natural and anthropogenic sources accounted for 46% and 54% of oil slicks by volume, respectively. The more recent paper, which looks at area rather than volume, finds that natural sources account for only 6.2% of the total, with anthropogenic sources responsible for the rest.
Hu Chuanmin said that the NRC report used a number of assumptions and inferences, while the oil slick map is based on direct measurements of area, and so the two sets of figures cannot be compared: “The two studies used very different statistical methods. But looking at it logically, the increase in human activity over the last 20 to 30 years, particularly in shipping, will have increased anthropogenic source oil slicks.”
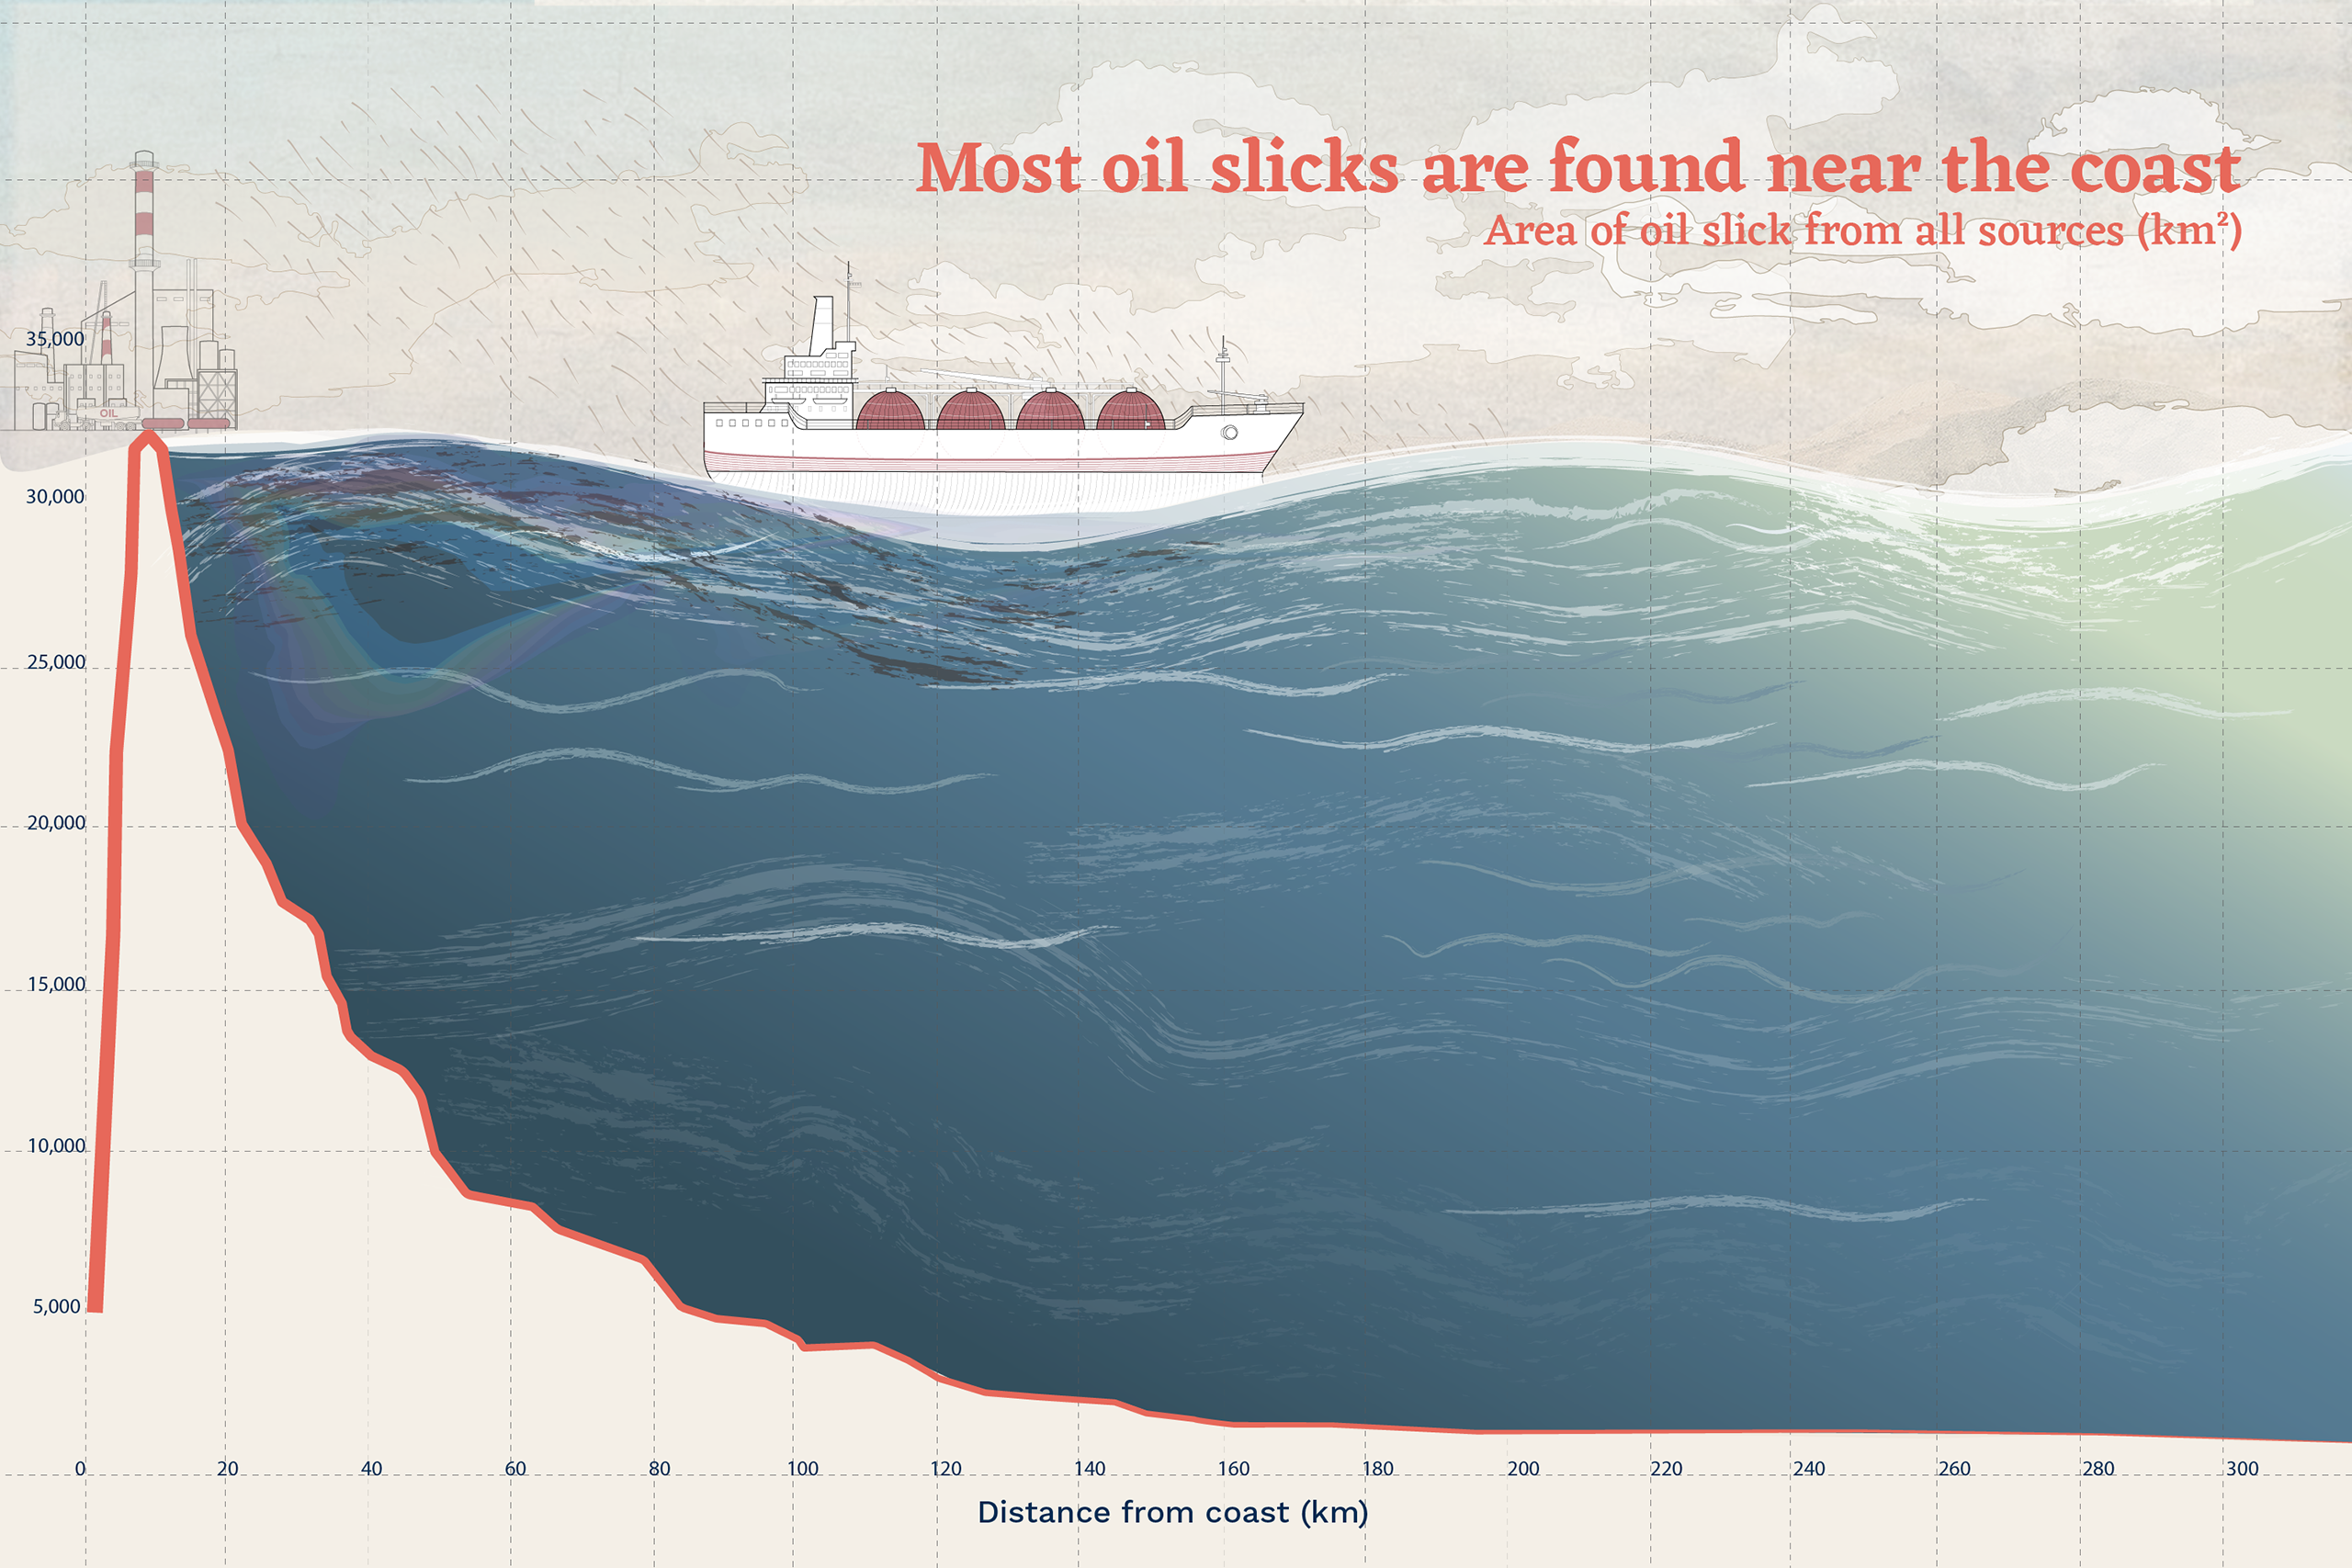
According to the research, anthropogenic oil slicks are found mainly in coastal areas, with about half of the cumulative oil slick area observed within 38 km of the coastline, and 90% within 160 km of it. The key land sources of oil pollution identified so far include: oil-containing effluent from coastal refineries and factories; municipal wastewater; and waste oil from vehicles, factory machinery and industry. Such oil enters the ocean via wastewater systems and runoff from the land.
Oil contained in the exhaust fumes of engines in machinery or vehicles can also reach the ocean in precipitation. But these are scattered and longer-term discharges of oil, and the researchers were unable to say how much any one source contributes to the overall problem.
 (Data source: Dong et al, Science 376, 1300–1304 (2022); Graphic: Javiera Pizarro Osorio / China Dialogue Ocean)
One of the researchers, oceanographer Ian MacDonald of Florida State University, pointed out in an interview that the global population has increased by 2 billion since 2000, and most of those new arrivals live in coastal regions. As populations grow, so do industries, road networks and vehicle transportation. Runoff from those activities ends up in the ocean.
How do ships contribute to slicks?
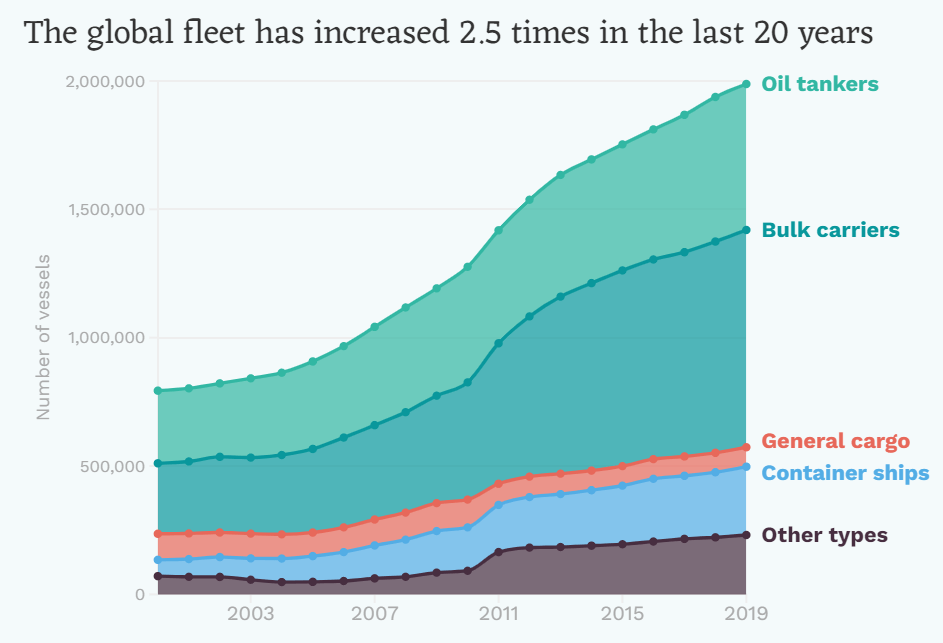
The researchers also identified 21 oil slick “belts” that match closely with busy shipping lanes. They said shipping accounts for at least three times as much oil slick area as natural sources. This is related to an increase in global shipping – carrying capacity rose by 2.5 times between 2000 and 2019.
Estimates in 2014 by World Ocean Review put the quantity of oil entering the ocean every year at 1 million tonnes, with tanker disasters accounting for only around 10% of that, and 35% coming from normal shipping activity. An Interpol report has identified the three major types of oil pollution originating from large vessels as bilge waste, sludge-type waste and oil cargo residues. As so many ships emit oil pollution, this type of contamination is very hard to control.
 (Graphic: Javiera Pizarro Osorio / China Dialogue Ocean)
Oil-contaminated bilge waste is the most common form of oil pollution from ships. Engines and machinery on container carriers, tankers and cargo ships inevitably leak fuel and lubricants. Those liquids find their way to the bottom of the vessel and mix with water that accumulates there. That bilge water can corrode the hull of the vessel and damage cargoes. If too much accumulates, the stability and safety of the ship can also be affected. So, it is regularly pumped out.
Sludge-type waste comes from the ship’s fuel. Large vessels usually run on cheap heavy fuel oil, which contains pollutants not removed during refining. To prevent those contaminants damaging the engine, the fuel is passed through filters, with the resulting sludge stored in tanks. Lubricants are subject to a similar process, with the sludge ending up in the same tank. Generally, 1–2% of heavy fuel oil is contaminants. Fuel sludge should be retained on board until it can be properly disposed of ashore, but sometimes it is discharged illegally into the ocean.
Oil cargo transportation, meanwhile, presents particular challenges. There are some small leaks of oil when tankers load or unload. Then, once empty, some vessels may fill their cargo tanks with seawater for ballast, which is necessary when travelling especially in bad weather. When no longer needed, this water is pumped back out into the ocean, contaminants and all. This only happens on small vessels, however, as most of today’s oil tankers (crude carriers with a deadweight of over 20,000 tonnes and carriers of other products with a deadweight of over 30,000 tonnes) are required to have segregated ballast tanks.
But even on large ships, when there is a change of cargo type – from crude to fuel oil, for example – or the vessel docks for maintenance, the tanks must be cleaned out to remove residual oil products. That creates heavily contaminated water known as tank washings.
The International Maritime Organization (IMO), a UN body charged with managing the shipping industry, drafted the International Convention for the Prevention of Pollution from Ships, known as MARPOL 73/78. The convention rules that oily wastewater must be treated on board and only discharged when the relevant standards are met. It also designates areas including the Mediterranean, the Baltic and the Red Sea as “special sea areas” with extra protections. The Antarctic south of 60 degrees latitude is also designated a special area, where no oil-contaminated waste can be discharged.
Breaches of the rules are common, even if sometimes accidental. A report from the Organisation for Economic Co-operation and Development (OECD) said that data from port states shows almost half of vessels submitting to checks were in breach of at least one international environmental regulation on the loading, unloading and handling of oils. According to the report, the main motivation for illegal discharges of oil was, without question, financial. The minimal chances of being caught and the low fines mean shipping firms can cut costs with illegal discharges and undercut more law-abiding rivals.
Prevention is better than clean-up
While major oil spills can be tackled with containment booms, clean-up vessels and chemical treatments, or even burned off, there is no established approach for dealing with thinner, more widely dispersed slicks. All that can be done is to reduce discharges in the first place. Liu Yongxue, corresponding author of the Science paper and a professor at Nanjing University’s School of Geographic and Oceanographic Sciences, says that cleaning up the ocean after a slick is very expensive. Protection of the ocean needs to focus, therefore, on prevention.
While the diversity and complexity of land-based sources make action difficult, new technology is making monitoring ship discharges easier. For example, the European Maritime Safety Agency’s CleanSeaNet satellite monitoring system can locate and track ocean pollution, providing accurate data on the position, spread and source of discharges.
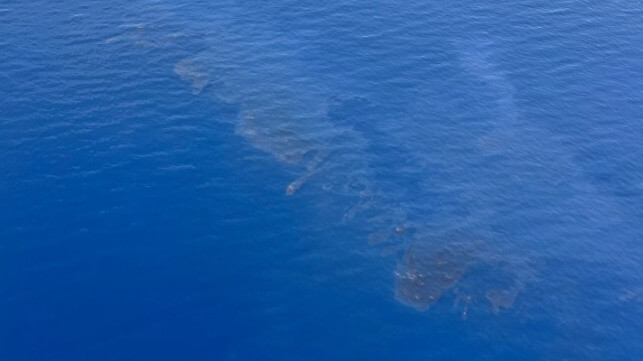
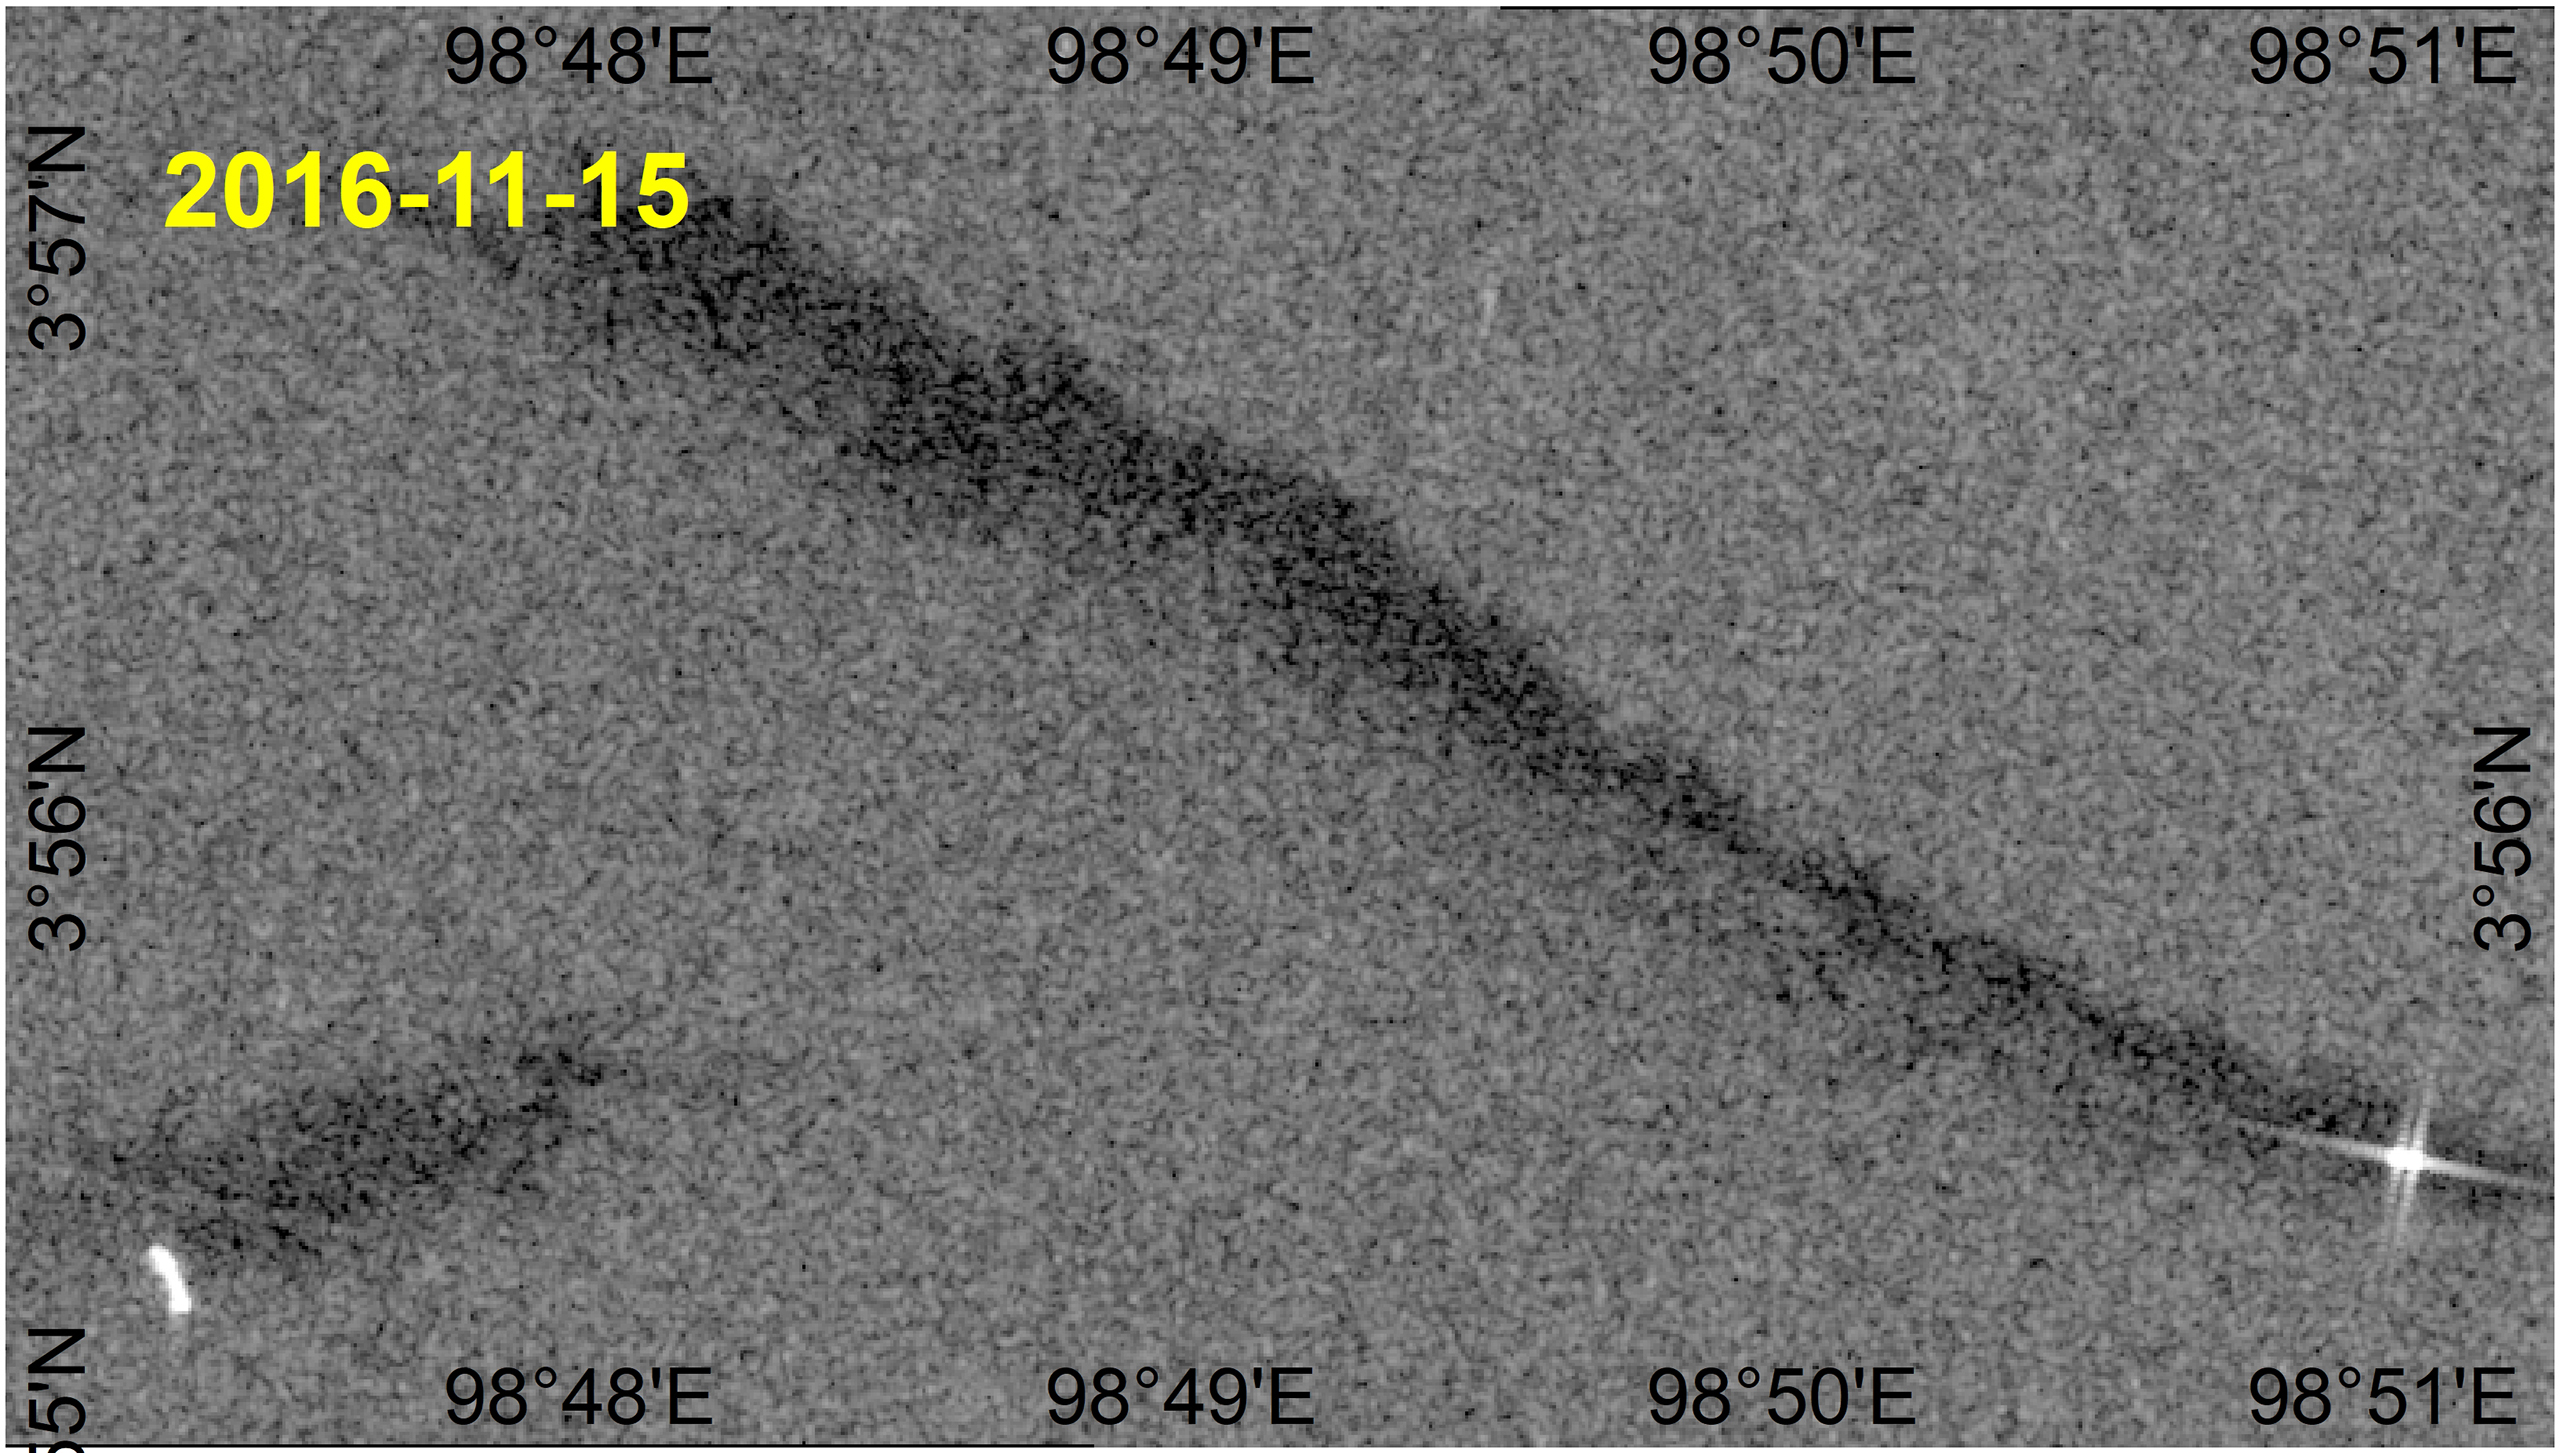 Two of the thousands of radar images used by the authors of the Science paper to gather data. These images, taken by the Copernicus Sentinel-1 satellites, show linear oil slicks from ship discharges. (Images © Dong et al)
Meanwhile, fines and other sanctions can have some deterrent effect. In US waters, illegal discharges of oil from ships can be met with heavy fines: in 2021, a firm headquartered in Cyprus was fined US$2 million and placed on probation for four years after concealing illegal discharges of oily water in the Atlantic by one of its vessels.
But only a few countries worldwide are able to put effective monitoring and enforcement in place. For ship operators, there is minimal risk of being caught and punished for illegal discharges of oil when on the high seas or in the waters of countries with weak monitoring and enforcement.
Algorithmic methods of processing satellite images, says Hu Chuanmin, are powerful and easy to use, and increase the likelihood of illegal discharges being spotted. The new map of oil slicks provides accurate information on their locations and frequency between 2014 and 2019. That data can help direct oil slick management and inform action by regulation and law enforcement bodies.
An alternative prevention measure from the OECD gets to the heart of the matter – changing the fuel used by long-distance shipping. If the shipping sector could switch from heavy fuel oil to a cleaner source of energy much less sludge would be produced.
At COP26 in Glasgow last year, 22 countries, including the UK, US, Germany and Japan, signed the Clydebank Declaration, establishing a number of zero-emission shipping routes or “green shipping corridors”. The focus here is on reducing greenhouse gas emissions, but there could be important co-benefits for reining in oil discharges.
Similarly, in 2021 the IMO announced a ban on the use of heavy fuel oil by ships in the Arctic, to come into effect on 1 July 2024, though there were controversial exemptions. In comparison to the stringent ban on the use of heavy fuel oil in the Antarctic passed in 2011, the Arctic regulation seems lax.
The IMO can only work on international consensus and the decision-making process is slow. Cutting the environmental impact of shipping will take joint efforts by all involved. Ship owners and operators should respect the rules and norms on discharges, while nations must monitor the problem, with strong law enforcement and punishments.
Niu Yuhan is Assistant Editor at China Dialogue. She previously worked for The Paper and WWF-UK. She holds a Bachelor’s degree in Journalism from Shih Hsin University and a Master’s in International Relations from King’s College London.
This article appears courtesy of China Dialogue Ocean and may be found in its original form here.
The opinions expressed herein are the author's and not necessarily those of The Maritime Executive.