
Australia and the U.S. Lead LNG Trade Growth
Global trade in LNG reached 38.2 billion cubic feet per day (Bcf/d) in 2017, a 10 percent (3.5 Bcf/d) increase from 2016 and the largest annual volume increase on record, according to the Annual Report on LNG trade by the International Association of Liquefied Natural Gas Importers. Australia and the U.S. were among the countries with the largest increases (2.7 Bcf/d combined) in 2017 LNG exports.
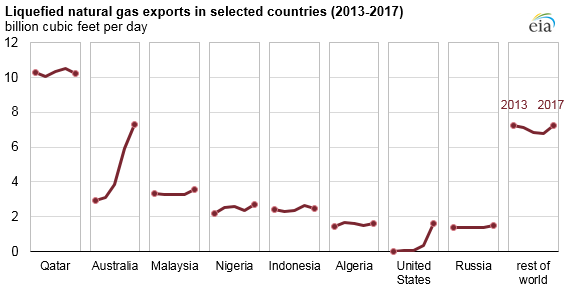
In 2017, there were 19 LNG exporting countries and 40 LNG importing countries. The return to service of Angola LNG and increases from several countries including Nigeria, Malaysia, Algeria, Russia and Brunei added another 1.4 Bcf/d of LNG exports, more than offsetting a combined decline of 0.6 Bcf/d in exports from Qatar, Indonesia, Norway, Peru, the United Arab Emirates and Trinidad.
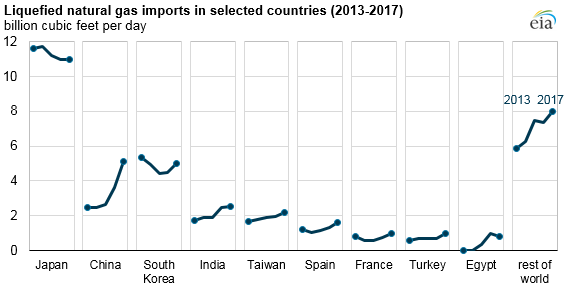
Asian countries led the growth in global LNG imports, accounting for 74 percent (2.6 Bcf/d) of the increase in 2017. Japan remains the largest LNG importer, importing 11.0 Bcf/d in 2017. China had the largest growth in LNG imports globally (1.5 Bcf/d) and became the world’s second-largest LNG importer in 2017, surpassing South Korea. LNG imports also increased in South Korea, Pakistan, Taiwan and Thailand, which collectively added 1.0 Bcf/d.
Europe increased its LNG imports by 1.4 Bcf/d, primarily in Spain, Italy, Portugal, France and Turkey. LNG imports in the United Kingdom declined by 0.34 Bcf/d (35 percent), one of only two countries in Europe to experience declines in LNG imports, as lower winter heating demand from the residential sector and increased electricity generation from wind reduced the demand for natural gas.
LNG imports in South America (Brazil, Argentina, Chile and Colombia) remained essentially unchanged from 2016. In North America, Mexico’s LNG imports increased by 17 percent, as the country continued to rely on LNG supplies amid declining domestic production and construction delays in infrastructure connecting the Mexican domestic grid to natural gas pipeline exports from the U.S. LNG imports into the Middle East declined by nine percent, primarily to Egypt and the United Arab Emirates (Dubai).

that matters most
Get the latest maritime news delivered to your inbox daily.
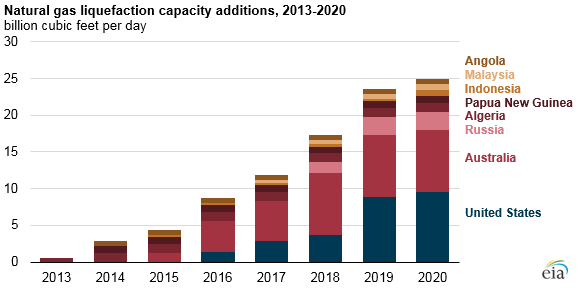
Growth in LNG trade was driven in part by new liquefaction capacity commissioned in Australia, the U.S. and Russia, collectively adding 3.4 Bcf/d of liquefaction capacity. The world’s first floating liquefaction plant, Malaysia’s PFLNG Satu (0.2 Bcf/d capacity), was also commissioned in 2017. Since 2013, the U.S. and Australia have added a combined 9.67 Bcf/d of new liquefaction capacity, with another 8.3 Bcf/d expected to be completed by 2020. Including additions in the U.S. and Australia, liquefaction projects currently under construction are projected to increase global liquefaction capacity by 13.5 Bcf/d by 2022.
The U.S. is expected to add 6.05 Bcf/d of new liquefaction capacity by 2021, in addition to 3.5 Bcf/d already in operation at Sabine Pass and Cove Point. This year the Elba Island liquefaction project in Georgia is expected to commission the first six of 10 small modular liquefaction units, or trains, with a combined capacity of 0.2 Bcf/d. New trains at Cameron, Freeport, and Corpus Christi, all along the U.S. Gulf Coast, are expected to be commissioned in the next three years.