
COVID-19: A Maritime Perspective
Without a doubt the entire world has been affected in some way or another by COVID-19. This event has ignited an intense amount of research resulting in data analysis, visualizations, models, and dashboards being created on a daily basis in order to help better understand the current impact, how this pandemic may have happened, and what the near-term future may look like.
Unsurprisingly, the maritime community has also been affected in a big way. Recently, ports have started quarantining vessels for up to 14 days before they enter the destination port, depending on whether their last port visit was in a highly infected country1,2,3. This concern is not unfounded since COVID-19 cases have recently been confirmed for the first time on a container ship4. Quarantining vessels will lead to a tremendous impact on global trade and commerce due to vessels being held for up to 14 days before exchanging goods.
CCRi was interested in seeing if we could identify the impact of COVID-19 on maritime traffic using our existing tools and data. With the analytic and visual tools of our Optix platform, we found that we could build port-based risk score models using reported COVID-19 infection data along with geospatial port boundary data to give insights about potential vessel destination risk and implications on trade and commerce. In this case risk is defined by the location of the last port visited by a vessel relative to nearby infected regions.
Analyzing Maritime Activity with the Optix Platform
The research and results described here focus on COVID-19 from a maritime perspective using the Optix platform. Optix provides a way to analyze real-time maritime traffic by ingesting and displaying satellite-collected Automatic Identification System (AIS) data along with other maritime-related contextual layers (for example, port/country boundaries and economic exclusion zones). For this project we used global AIS provided by exactEarth to identify vessels that are inbound to the US and then retrieved their location history to further determine which ports and countries they visited before departing for the US. This is important from both the perspective of the vessel carrier and the port authority due to potential quarantine times before actually unloading or receiving cargo.
Using Optix we can easily filter vessels of type Cargo, Tanker, Passenger, and Pleasure Craft that have a declared LOCODE destination for any US port. We used this filter criteria to query for one week of AIS history. For each vessel within this dataset, we determined the last port and associated country the vessel has visited. We then used this information to supplement the AIS record.
We also loaded the JHU COVID19 dataset5 into Optix to obtain the infection, recovery, and death counts along with locations of the infected regions. For each port, we identified infected regions within that port’s country and then used their infection statistics and the geographic distance between the port and those regions to calculate an infection risk factor for that port. When a vessel that was determined to have passed through a port, we applied the associated port risk to that vessel. With risk scores applied to all US-bound vessels based on their prior port visit, an aggregated risk could be found for a destination port.
US-Bound Vessels
The Optix platform provides graphical representations of geospatial datasets known as “layers” that it displays as overlays on a map that a user can navigate through the browser-based Optix user interface. One of these live layers displays real-time satellite-collected AIS from global vessels. We applied an ECQL filter to this layer to only show vessels that have declared the US as a destination using a LOCODE value consisting of a two-digit country code and a three-digit port code–for example, USNYC. Once these vessels were identified we used their Maritime Mobile Service Identity (MMSI) values to retrieve one week’s worth of their historical AIS data. Querying for one week and filtering to US LOCODE values retrieved about 1.5 million records for 187 unique vessels. The image below shows these vessel colored by their MMSI identifier:
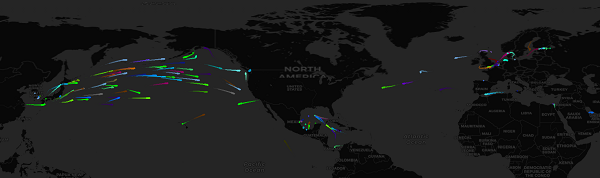
One week historical AIS for vessels having a declared destination port within the US
Determining Last Port Visit
The AIS standard provides static and dynamic report vessel data but offers no way to report on a vessel’s last port visit. To find these visits, we supplemented the AIS record with data about the last port visited using a world port geometry layer6. Using this ports layer, we analyzed all the vessel traffic of interest to determine which port the vessels last visited. The metadata for each vessel was then enriched with this value. In the below example, the tanker Largo Mariner with MMSI 538007574 indicates a last port visit to Antwerp, Belgium:
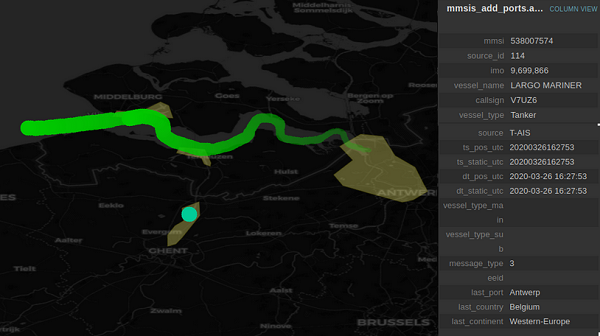
Example of vessel leaving Port of Antwerp recording of last port field in record
Determining the Impact and Risk on the US
Next, we sought to determine what this could tell us about risk or potential impact from vessels inbound to the US. The time-lapse histogram below shows an upward trend in inbound vessels starting around March 22. This could be related to goods being held up in other countries that are making their way to the US or increased supplies. The chart shows the breakdown of these vessels by last country visited and can be used to select individual or multiple ports.
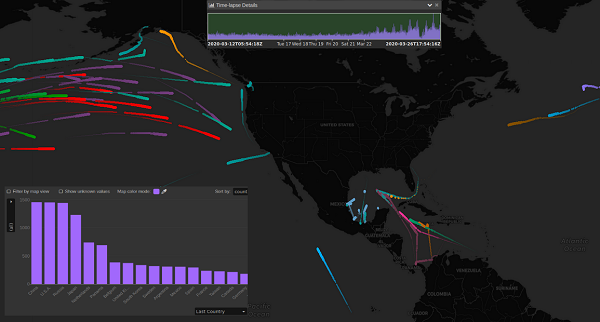
One week of historical AIS for US-bound vessels colored by country of last port visit
In the image below the vessels are colored by last country. Multiple countries (China, South Korea, United Kingdom, France) have been selected using the bar chart.
Time-lapse of select US bound vessels
Building a COVID19 Risk Model for Ports
To further understand the potential impact of COVID-19 spread by vessels arriving from disparate ports, we built a notional risk score for each port. In the example below, we look at the Port of Shanghai, China where there is an infected region within the port geometry with 468 confirmed cases, including five deaths and 334 recoveries recorded as of 03/27/2020. The confirmed and death counts were used along with the haversine distance between the port polygon centroid and reported infection location to calculate the risk associated with the given port. The score is calculated by taking the sum of confirmed and death cases and dividing by the distance, which causes infected regions that are further away to become less significant while still accounting for multiple infection regions in a country. This was done for all 1,157 ports relative to the 3,429 infected regions collected by JHU.
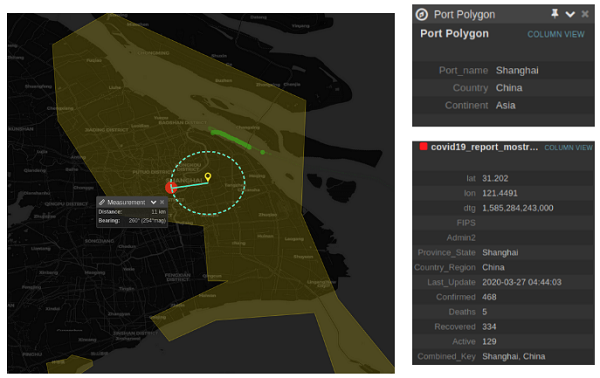
Left: Example of using port location, COVID-19 infection data, and the distance apart to calculate a port risk. Right: Port of Shanghai and COVID19 infection details.
COVID-19 Risk of US-Bound Vessels Based on Previous Port
Using each port’s risk score in combination with vessels’ data enriched with their port of call, CCRi can use the Optix platform to begin to analyze risk to the destination ports. Currently, multiple ports are imposing mandatory quarantine time periods for vessels arriving from highly infected regions, such as the Hubei Province of China, Italy, Iran, South Korea, and the United States. As more ports begin to impose mandatory quarantine periods, we can leverage this data to determine when and where to take action that will have the most impact while balancing the impact on trade.
In the image below, the same vessels shown previously are colored by a color ramp based on the risk score of the the vessel’s last port visit. A brighter red represents a potentially riskier vessel, while a fainter red represents a potentially less risky vessel. Vessels located near European ports show the most associated risk given their port visits during this particular period of time; not many are traversing the Atlantic to the US.
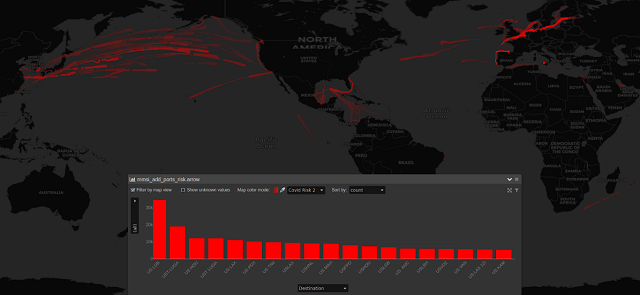
US-bound vessels color ramped by their potential COVID19 risk
Looking in the Pacific shows many more vessels on their way to the US west coast. Optix’s chart feature can be used in this scenario to inspect the destination ports and select one or more to filter the map. The image below illustrates this feature by selecting the destination LOCODE for Port of Long Beach (US LGB and USLGB) which filters the map to only those vessels. A few brighter shaded vessels can be seen coming out of Shanghai, China where many close surrounding areas have high infection rates.
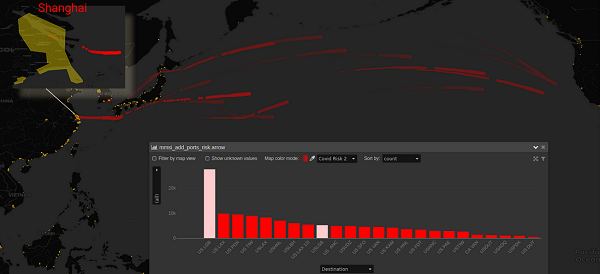
Vessels with a destination of Port of Long Beach color ramped by their potential COVID19 risk
The total impact of the COVID19 outbreak on the maritime industry continues to evolve but is guaranteed to be substantial. The ability to know which vessels are headed to a particular country in real time and which ports and countries they most recently visited could be very valuable for port authorities, government organizations, and health organizations.
Next Steps: Earlier Alerting and Forecasting
CCRi has a lot of expertise building and applying Machine Learning and Artificial Intelligence algorithms to drive real-time and predictive models. In our follow-on work, we plan to adapt some of these methodologies to give us earlier warnings of risk and a more refined forecast of the impact of this risk on traffic. Features could include:
• Live alerting based on attribute changes (for example, changes in destination or navigation status values)
• Vessel quarantine tracking
• Vessel volume forecasting by port
We hope that this work can make some contribution to a better understanding of how to mitigate some effects of the pandemic.
References
1. https://www.thehindubusinessline.com/economy/logistics/freight-rates-set-to-spike-as-india-puts-ships-arriving-from-corona-infected-nations-on-14-day-quarantine/article31129907.ece
2. https://www.nepia.com/industry-news/coronavirus-outbreak-impact-on-shipping/
3. https://www.bloomberg.com/news/articles/2020-03-18/chinese-port-restricts-ships-from-virus-hit-nations-for-14-days
4. https://www.maritime-executive.com/article/first-confirmed-covid-19-cases-on-a-container-ship
5. https://github.com/CSSEGISandData/COVID-19
6. Environmental Change Institute, University of Oxford, UK

that matters most
Get the latest maritime news delivered to your inbox daily.
About CCRi: CCRi builds real-time multi-domain global situational awareness tools and technologies by applying innovative data science, scalable software engineering, and advanced visualization to solve meaningful challenges. Founded in 1989 and currently employing over 130 data scientists, developers, and engineers, CCRi is located in Charlottesville, Virginia (US). For more information or to get connected, reach out to us at [email protected].
This blog post relies upon publicly available data from multiple sources that do not always agree. CCRi hereby disclaims any and all representations and warranties with respect to the post, including accuracy, fitness for use, reliability, and non-infringement. Reliance on this post for medical or commercial guidance is strictly prohibited.
The opinions expressed herein are the author's and not necessarily those of The Maritime Executive.