
BP: Global Carbon Emissions Rose in 2017
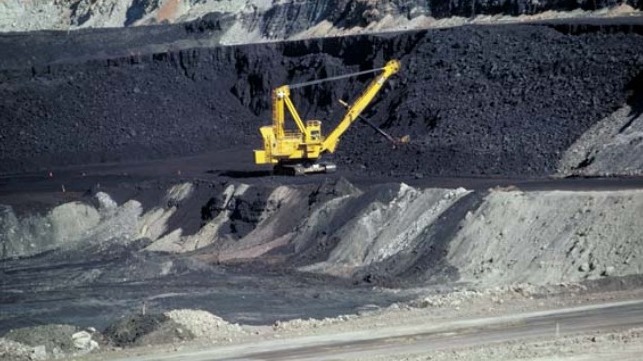
Global primary energy consumption grew strongly in 2017, led by natural gas and renewables, with coal’s share of the energy mix continuing to decline. However, with the rising demand for energy, 2017 saw a material increase in carbon emissions of 1.6 percent following three years of little or no growth.
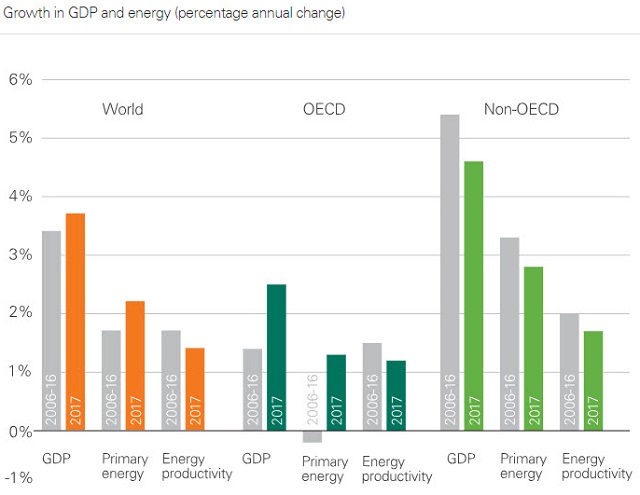
That's according to the 2018 edition of the BP Statistical Review of World Energy which indicates that global energy demand grew by 2.2 percent in 2017, a figure higher than the 10-year average of 1.7 percent. This above-trend growth was driven by stronger economic growth in the developed world and a slight slowing in the pace of improvement in energy intensity. China’s most energy-intensive sectors returned to growth, and coal consumption increased for the first time in four years, led by growing demand in India and China.
Power generation rose by 2.8 percent, close to the 10-year average. Practically all growth came from emerging economies (94 percent). Generation in the OECD has remained relative flat since 2010.
Renewables grew strongly in 2017, with wind and solar leading the way. Renewables accounted for almost half of the growth in power generation (49 percent), with most of the remainder provided for by coal (44 percent). The share of renewables in global power generation increased from 7.4 to 8.4 percent.
Bob Dudley, BP group chief executive, said: “2017 was a year where structural forces in the energy market continued to push forward the transition to a lower carbon economy, but where cyclical factors have reversed or slowed some of the gains from prior years.
“As we have said in our Energy Outlook, our Technology Outlook and now our Statistical Review, the power system must decarbonize,” says Dudley. “We continue to believe that gains in the power sector are the most efficient way to drive down carbon emissions in coming decades.”
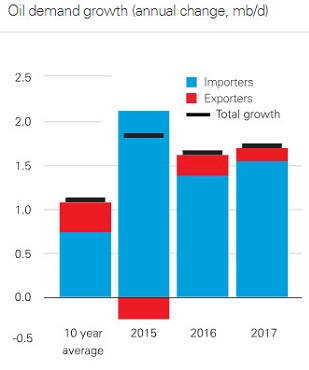 The review found that demand for oil grew by 1.8 percent while growth in production was below average for the second consecutive year. Production from OPEC, and the 10 other countries that agreed cuts, decreased while producing countries outside of that group, particularly the U.S. driven by tight oil, saw increases. Consumption exceeded production for much of 2017, and as a result OECD inventories fell back to more normal levels.
“To put the recent strength of oil demand in context, average growth over the past five years is at its highest level since the height of the commodity super-cycle in 2006-07,” says Spencer Dale, group chief economist for BP. “This was despite all the talk of peak oil demand, increasing car efficiency, growth of electrical vehicles. All of those factors are real and are happening, but persistently low oil prices can have a very powerful offsetting effect.”
2017 was a strong year for natural gas with consumption up three percent and production up four percent – the fastest growth rates since the time immediately following the global financial crisis. The single biggest factor fueling global gas consumption was the surge in Chinese gas demand, where consumption increased by over 15 percent, driven by government environmental policies encouraging coal-to-gas switching.
“The tidal wave of LNG projects that were sanctioned between 2009 and 2014 led many to predict the emergence of surplus LNG as it took time for demand to catch up with the rapid growth in supplies,” said Dale. “But many observers have so far been surprised by the apparent absence of such a glut. There is certainly little evidence of LNG facilities standing idle due to a lack of demand.
“This absence partly reflects that, due to a variety of technical issues, actual LNG supplies have come on stream less quickly than originally planned, moving supply more into line with the original demand profiles. However, the apparent absence of a glut also reflects the fact that the surplus LNG supplies which did emerge resulted in bouts of unsustainably low prices rather than a build-up of idle capacity.”
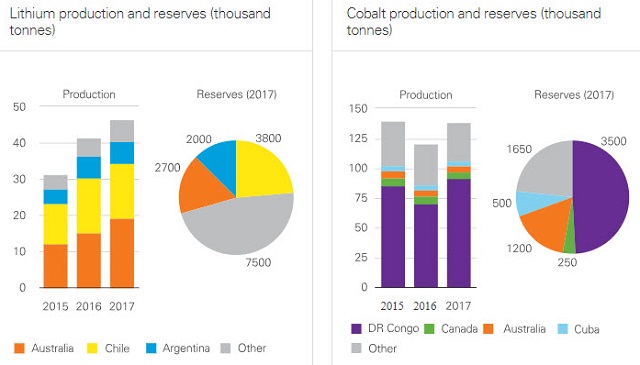
Production of cobolt, a common raw material used in battery technology, has grown by 0.9 percent per annum since 2010, while lithium production has increased by 6.8 percent per annum over the same period.
Lithium carbonate prices increased by 37 percent in 2017. Lithium production is concentrated in Chile and Australia, with Chile holding the majority of proved reserves. Lithium production increased by almost 50 percent between 2015 and 2017, as prices more than doubled.
Cobalt prices more than doubled in 2017. The Democratic Republic of Congo accounts for the vast majority of both production (66 percent) and proved reserves (49 percent) of cobolt. Cobalt prices picked up sharply last year as demand increased, says Dale, but this has not yet fed through into a significant increase in production. The pace of this response may be affected by the fact that cobalt is produced as a by-product of copper and nickel mining and so production depends on price trends in these metals as well.
“In terms of whether the availability of either of these metals could act as a constraint on the growth of electric cars, that question really deserves a whole presentation on its own,” says Dale. “The short answer is that if either metal is likely to pose a bottleneck, it appears most likely to be cobalt. The announced expansion plans for lithium production look sufficient to ensure ample supplies for the next 10 or 15 years.
“In contrast, the geographical concentration of reserves, together with the nature of its production process, means this is less clear for cobalt. But the new wave of battery technologies now being developed require less cobalt. So rather than act as a constraint on the growth of electric vehicles, the availability of cobalt could simply provide further momentum to this technological change. Watch this space.”