
Investigating the America's Cup Wing Sails
By Alessandro Fiumara - Assystem France and ISAE-Supaéro; Julien Senter - Assystem France; Nicolas Gourdain & Vincent Chapin - ISAE-Supaéro; and Prashanth Shankara - Siemens PLM Software
The America’s Cup, affectionately known as the “Auld Mug,” is the oldest sporting trophy in the world dating back to 1851. Pushing the limits of sailing and sailors alike, the prestigious competition has seen a surge of interest in recent years riding on the coattails of fast yachts, technological innovations, high profile athletes and teams backed by billionaires.
Catamarans introduced in the 2013 America’s Cup were faster than the wind, thanks to the introduction of hydrofoils and of solid two elements wingsails, which share similarities with high-lift aircraft wings. The wingsails were based on rules and guidelines outlined in the AC72 class, used in the main race, and the AC45 class, used for preliminary races and training.
The newer class catamarans are unlike any other previous catamarans, reaching twice the wind speed and hydrofoiling on water, leading to a surge in spectator interest. The 35th America’s Cup will be held in June 2017 on the Great Sound of Bermuda and will be raced in the new AC50 class, a wing sail powered, fast, foiling catamaran smaller than the AC 72, manned by a six member crew.
Compared to conventional “soft” sails, a wingsail is much more complex, providing lift with variable camber, controlled by a flexible or jointed structure. The wingsails offer greater aerodynamic efficiency compared to the canonical sails and better performance, as seen by top speeds of around 47 knots (87 km/h) in the races. While this has made the races faster and more exciting to the viewing public, the challenges lie - as always - in handling these wingsails and managing their aeroelastic behavior to achieve the highest performance during navigation.
.jpg)
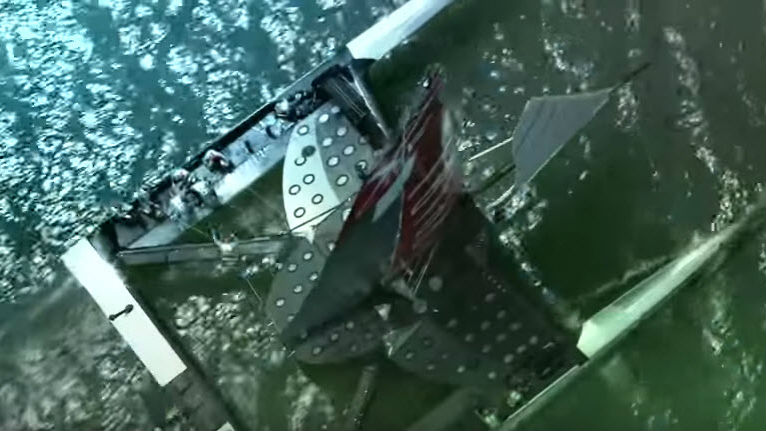
FIGURE 1: Team Oracle America’s Cup yacht with wing sail (left) and a capsized catamaran (right)
These wing sails are difficult to control and the research on their stability in multiple scenarios is still evolving. Finding a stable setting in all navigation conditions for these wing sails is challenging and there have already been a couple of instances of catamarans “flipping” or “falling over” due to this instability. As in the aerodynamic stall of an airplane wing, these wing sails can stall during operation and it is crucial for designers to understand their stall behavior under different wind conditions.
To further the understanding of wing sail behavior, a PhD research project was initiated by Assystem France, an international engineering and innovation consultancy, and the Department of Aerodynamics, Energetics and Propulsion (DAEP) at ISAE-Supaéro, the renowned French Aerospace Engineering School.
The wingsail aerodynamic behavior near the stall conditions is not well understood as well as the sailing envelop of this rig still largely unknown. Thus one of the goals of this work was to describe and better understand the flow characteristics on the wing sail in order to identify the relation between design and trim parameters and performance to find the optimum wingsail configuration for each operating condition.
CHOOSING THE ANALYSIS METHOD
To properly investigate the wing sail behavior, the researchers designed a wing sail based on the AC72 class catamaran used by Team Oracle in the 2013 America’s Cup. Wind tunnel testing is the first and foremost option but is limited by the number of tests that can be run, cost of operation and does not lend itself to easy parametric analysis and design optimization.
As with all the marine designs in this day and age, the team decided to use numerical simulations to study the wing sail behavior. In addition to being cost effective and suitable for design sweeps and optimization, a computational fluid dynamics (CFD) analysis can shed light on some of the characteristics difficult to investigate in a wind tunnel.
The next question is the choice of tool for the numerical simulation. STAR-CCM+, already widely used at Assystem France, was selected to perform these analyses. Aside from convenience, the choice of STAR-CCM+ was based on:
• High quality polyhedral meshing that allowed excellent capture of wake flow;
• Flexibility of STAR-CCM+ to be tailored to a specific problem and option for design optimization;
• Excellent academic licensing options which enabled multiple simulations to be run at ISAE-Supaéro;
• Well established in the marine industry.
WIND TUNNEL TESTS MODELING
Validation of the numerical method with experimental data is the key to accurate analysis. A 1/20th scale model of the wing sail without the catamaran was built for wind tunnel testing in the S4 wind tunnel (Figure 2) facility at ISAE in Toulouse. The wind tunnel is an Eiffel (open return) wind tunnel, with an open test section of elliptical shape. The geometry is a two-element swept wing with a main element and a flap with a constant slot between elements along the wingspan. The flap angle can be modified by deflections to change the global camber of the wing.
Wind tunnel tests were performed both for the numerical validation of STAR-CCM+ at different wing sail settings and to obtain an exhaustive experimental database for the flow analysis. The aim of the research project is not directly to find the best setting during navigation but to completely investigate the flow mechanisms around the wing sail, deepening the analysis on the role of the jet flowing in the slot dividing the two wing sail elements, in the enhancement of the high-lift capabilities.
The numerical analysis in STAR-CCM+ was conducted on the same wingsail geometry reproducing also the wind tunnel domain in a way to take into account the interference between the wing and the facility domain.
The flow condition in the wind tunnel reproduced the experimental test characteristics both in velocity and in turbulence level. The computational domain was discretized with polyhedral cells in STAR-CCM+ (Figure 3).
Prism layers were automatically built at the surface to accurately resolve the boundary layer flow. The final mesh count was approximately 32 million cells. Unsteady RANS (URANS) equations were solved with incompressible fluid.
The flow speed in the wind tunnel duct was 20m/s resulting in mean chord Reynolds number of 5.3x10⁵. These flow conditions with moderate Reynolds number was challenging because they may give rise to laminar flow regions on the wingsail surface. The transitional k-ω SST turbulence model in STAR-CCM+ was used to account for the boundary layer transition from laminar to turbulent, predicting flow separation.
.jpg)
FIGURE 2: Test model of wing sail in S4 wind tunnel
.jpg)
FIGURE 3: Polyhedral STAR-CCM+ mesh around the wing sail
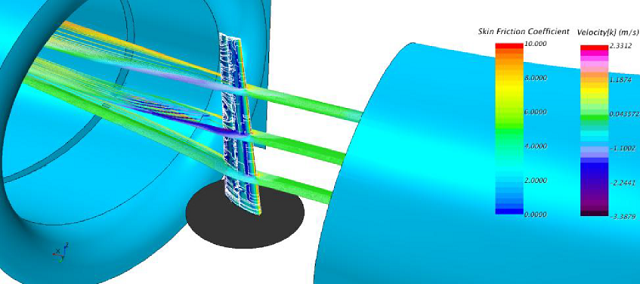
FIGURE 4: Streamlines colored by velocity around the wing sail, showing skin friction coefficient on the surface
The simulations showed excellent comparison with the wind tunnel data, both quantitatively and qualitatively. A comparison of flow separation on the wing between the wind tunnel test data and the URANS simulation shows that the flow characteristics are similar in the two approaches, with the flow separating on the higher sections of the flap while staying attached on the lower sections.
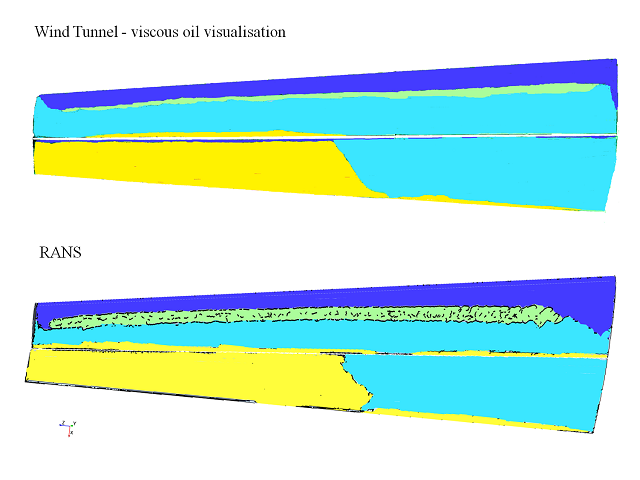
FIGURE 5: Skin friction coefficient comparison on wing sail from viscous oil visualization in wind tunnel and STAR-CCM+
Similar to the qualitative results, the quantitative results from the STAR-CCM+ simulations agreed well with the test data, reinforcing the validity and accuracy of the research method. A comparison of the pressure coefficient on the main element in a large slot configuration for high and low camber is shown in Figure 6. In areas of attached flow, the numerical and experimental data match very well for this configuration. In areas of separation on the flap surface, the numerical results are within 10 percent of the experimental data. This process has helped to validate the numerical methodology to predict the performance of the wing sail in different conditions.
From the simulation, the low cambered setting appears to be the best option for an upwind condition while for the downwind condition, the higher flap deflection angle performs better. The high camber configuration shows a certain sensitivity to the slot size dividing the two wing elements; a small modification of this size can offer performance improvements.
Results show the high sensitivity of the stall behavior to the flap deflection angle and slot size. In certain wingsail configurations, the wing has a multi-step stall with sections of the flap stalling at different angles of attack, while the main element stalls for the highest angles of attack. Wind tunnel tests and URANS simulations agree to show how a modification of this slot size will eliminate the multi-step behavior while offering a linear increase in lift coefficient.
The same slot size can change the final stall on the main element from abrupt to flat stall. Understanding and achieving a right slot size along the entire wingspan is of crucial importance for operational stability during the race but challenging because of the aeroelastic behavior of the wingsail in real conditions.
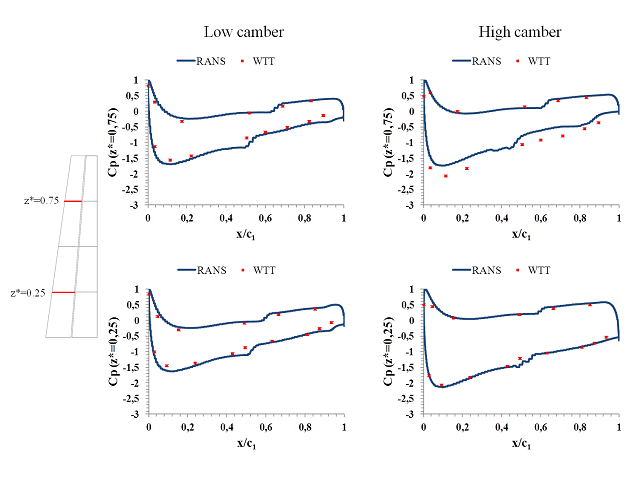
FIGURE 6: Comparison of Cp for low and high camber configurations between wind tunnel and STAR-CCM+
MODELING OF A C-CLASS CATAMARAN
To fully analyze the wing sail behavior in downwind condition, the geometry was scaled to a C-Class catamaran dimension. C-Class catamarans are used in the LITTLECUP race, the testing ground for the America’s Cup, where the latest technology in foiling catamarans is tested, compared and approved. These are also used in the International C-Class Catamaran Challenge Cup, an open design class with very simple design rules. The C-Class catamarans are known for their simplicity with a sail area that must not exceed 27.8 square meters, forcing designers to push the limits of design innovation to go faster.
The scaled down wing sail geometry was modeled along with the catamaran geometry to consider the wing-catamaran aerodynamic interaction in downwind condition. The sea boundary layer was modeled including wind twist, with lower angle of attack on the low sections, and higher angle of attack upward on the sail. The flap deflection angle was set to 35°, closer to the angle set by sailors in downwind conditions. In addition, flap deflection angles of 15° and 25° were also considered.
Figure 7 shows the comparison of pressure distribution (Cp) for the different flap deflection angles. Contrary to conventional wisdom, the 35° flap deflection angle was not found to be the angle that maximizes the driving force in downwind conditions. The driving force and heeling moment were calculated for the different angles, with the best performance achieved at maximum driving force and minimum heeling moment. The results show that at the conventional 35° angle, the flow is completely separated on the flap surface while it remains attached at 25°, increasing the driving force on the wing.
The wing sail response to gusts was also researched by introducing a sinusoidal law at the inlet velocity in the simulations. As seen in Figure 9, “mushroom” separation cells appear on the flap surface and spread with a wave structure to the entire wing sail span under gusts. It will be interesting to know if these flow patterns may be observed in real sailing conditions.
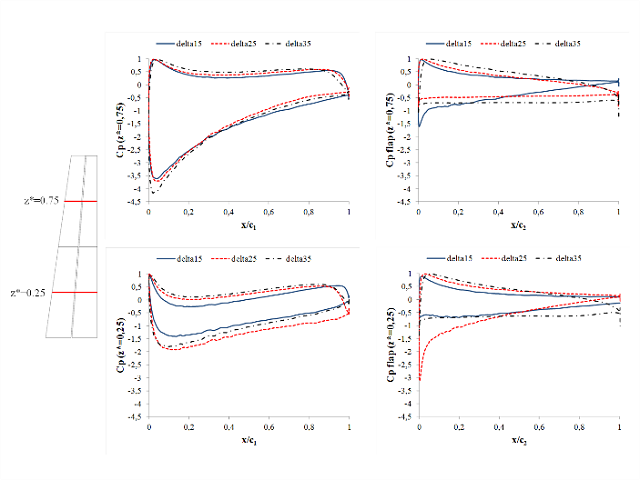
FIGURE 7: Cp comparison along the wing for different flap deflection angles
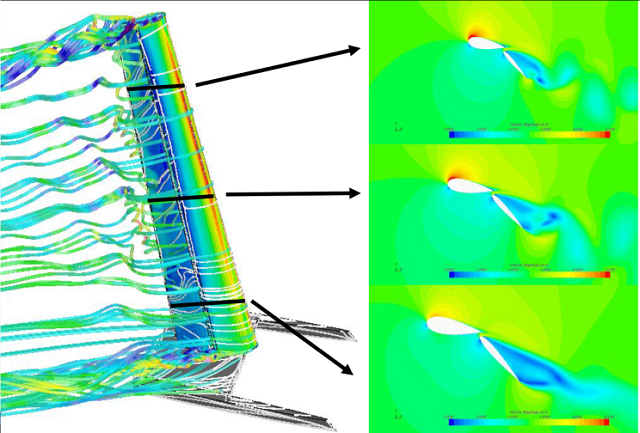
FIGURE 8: Pressure coefficient on wing sail and flow streamlines (left) and velocity magnitude at 25 percent, 50 percent and 75 percent of wing span (right)
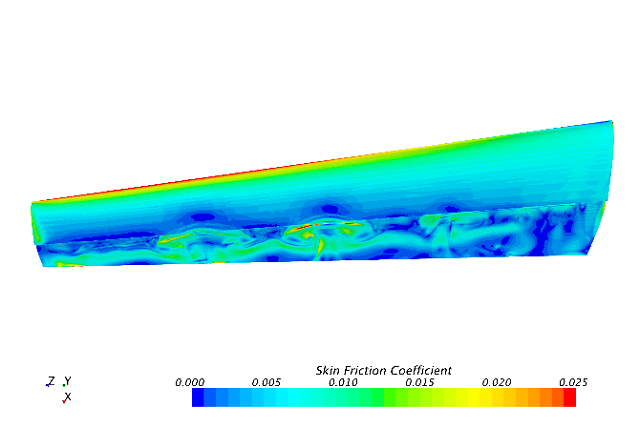
FIGURE 9: Skin friction coefficient on wing showing “mushroom” separation cells
CONCLUSION
This research has laid the groundwork for understanding the stability of the wing sails in the America’s Cup races and LITTLE CUP to be able to design better, faster and more stable wings for foiling boats. Future research will include the design and trim optimization to achieve the best driving force under a constraint of the maximum heeling moment bearable by the catamaran. Also, the origin and influence of the “mushroom” cells need to be investigated. The research team is also looking to collaborate with a sailing team from the 35th America’s Cup as a design partner. The use of numerical simulation has and will keep pushing the limits of speed and technology in the America’s Cup races.
The opinions expressed herein are the author's and not necessarily those of The Maritime Executive.