
Are We Measuring International Trade Correctly?

Op-Ed by Stephen Grenville
Perhaps the most fundamental change in international trade in recent decades has been the development of multinational supply chains. The production process has been unbundled, with different stages of production taking place in different countries. An iPad is assembled in China, but only $10 of the total production costs takes place in China; most of the total cost comes from inputs made in other countries, including the intellectual property and design input from Apple in California.
In conventional trade statistics, exports are counted in gross terms, so the cost of the assembled iPad (including those elements imported into China) is counted in China's export figures. Over recent years, the misleading implications of the gross trade figures have been more fully recognised. Since 2012, an alternative value-add data set has been available.
The Reserve Bank of Australia has built on this data to provide new insights into Australia's international trade, particularly on trade-partner shares. The diagram below, from the RBA, illustrates the issue. If Australia exports $100 of iron ore to China, which is then used as the input for products which China exports to the US worth $110, conventional statistics would record this as $100 of Australian exports and $110 of Chinese exports. But China has, in this exaggerated example, only added $10 of value.
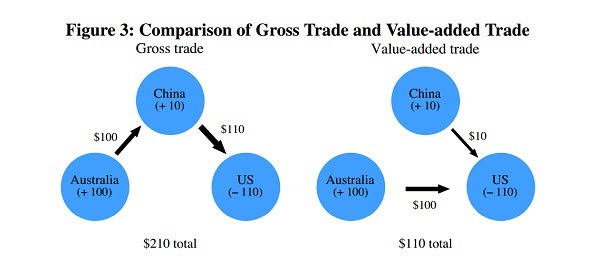
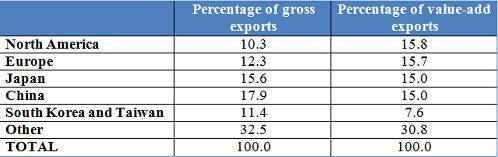
In this example, the destination of $100 of iron ore exported by Australia is no longer China, but, in final product form, America. Comparing the two measures of Australia's export destinations, we get the following table:
These value-added statistics also provide a very different perspective on the importance of the services sector to Australia's exports. In gross terms, services make up only 22 percent of exports, but services form an important input into other exports (especially manufactures). Recalculating exports according to value-added model takes the services component to over 40 percent of Australia's exports (a bit bigger than resources). This different perspective fits Australia's comparative advantage: our export future doesn't lie in manufactures, but in commodities and services.
These value-add statistics don't replace the conventional gross statistics, which are available more quickly and don't rely on so many assumptions. Nor are they the last word in the ongoing process of refining statics to reflect a changing world. But they provide a valuable alternative perspective, sometimes with policy implications. At the very least, they are a reminder of the complexity of international trade: our exports will depend not only on what is happening in China, but on what is happening in China's export destinations as well.
This article first appeared in the Lowy Institute’s Interpreter blog.